
Environment Monitoring dashboard: turning sensor data into meaningful information
A mining site can generate thousands of readings an hour — ground vibration, air overpressure, dust, noise, and gas levels, all streaming in from sensors spread across the pit. On their own, those numbers are just raw data. An environmental monitoring dashboard turns that flood of sensor data into clear, meaningful information people can actually act on.
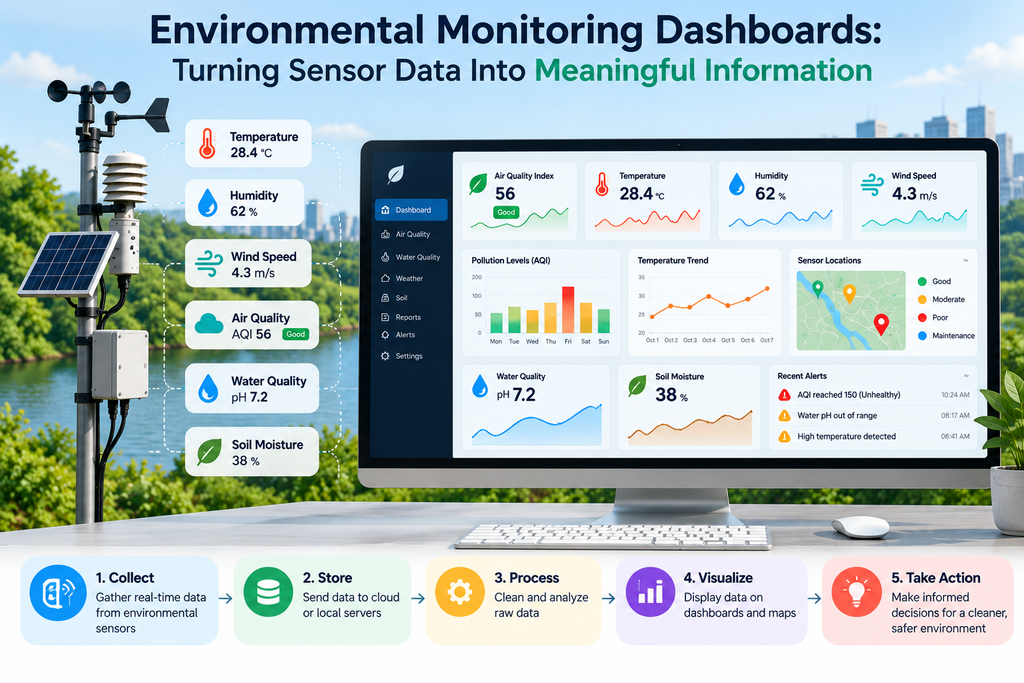
This guide explains what an environmental monitoring dashboard does, how good sensor data visualization works, and what to look for when choosing monitoring dashboard software for a real time mining operation.
▶ Watch: Brilliant Info Systems on YouTube
What Is an Environmental Monitoring Dashboard?
An environmental monitoring dashboard is a single screen that pulls environmental data from multiple sources — vibration sensors, air-quality monitors, dust and noise meters — and displays it as live charts, maps, and status tiles. Instead of reading spreadsheets after the fact, supervisors see the whole site at a glance, with real time updates as each new reading arrives.
The goal is simple: make the data easy to understand. A well-built dashboard uses data visualization — line graphs for trends, donut charts for air-quality breakdowns, and color-coded tiles for status — so anyone can tell in seconds whether the site is within limits. This is the same journey described in from sensor to dashboard, where raw readings travel from the field to the control room in real time.
The difference between a plain data table and a true dashboard is interpretation. A table lists numbers; a dashboard shows meaning. When a vibration reading climbs, the trend line bends upward and a tile turns amber before anything is breached. When air quality shifts, the donut chart changes shape. That instant visual feedback is what lets a supervisor explore data without being a data analyst — and it is why environmental data reporting has moved from monthly spreadsheets to live screens.
From Raw Sensor Data to Meaningful Information
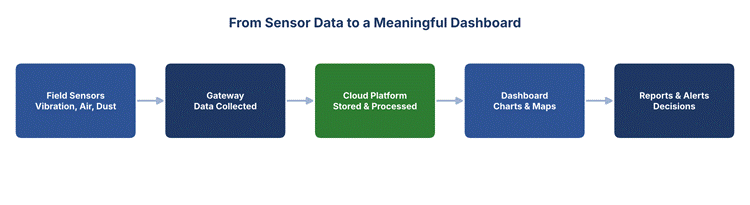
Turning environmental data into insight follows a clear path. Each stage adds structure until the final view is something a manager can use for data reporting and quick decisions:
- Capture: Field sensors record vibration, air, dust, and noise continuously.
- Collect: A gateway gathers data from multiple sources and sends it onward.
- Process: A cloud platform stores and cleans the readings, ready to explore data at any time.
- Visualize: The dashboard plots everything as charts and maps with real time updates.
- Act: Alerts and reports drive the next decision — clear an area, adjust a blast, or log compliance.
To see how that final step works in practice, read how blast monitoring data supports better decision-making.
Key Features of Good Monitoring Dashboard Software
Not every dashboard is built for a mine. When comparing monitoring dashboard software, these are the features that matter most for environmental monitoring:
| Feature | Why It Matters |
| Real time monitoring | Live readings and real time updates let teams react the moment a limit is approached. |
| Flexible data visualization | Line graphs, bar charts, and donut charts make trends and breakdowns easy to read. |
| Custom dashboard views | A custom dashboard per site or role shows each user only what they need. |
| Pre-built templates | Pre built templates and drag and drop interfaces get a site live without heavy setup. |
| Data reporting | One-click environmental data reporting produces a defensible compliance record. |
| Automated alerts | Threshold alerts notify the right people by SMS or email before a breach. |
Behind the screen, the platform connects to data warehouses and uses a query language to pull the right readings fast. Some teams prefer open source tools with a free trial, while others want a managed system tuned for mining. The right choice depends on site size, the number of sensors, and how much data analysis the team does in-house.
Ease of use matters just as much as power. Drag and drop interfaces and pre built templates mean a site manager can build a custom dashboard without writing code — adding a chart, moving a tile, or creating a new view in minutes. The best monitoring dashboard software hides the complexity of data from multiple sources behind a clean screen, so the team spends time acting on information rather than wrestling with it.
Why Real Time Mining Dashboards Matter
In mining, conditions change by the minute. A real time mining dashboard keeps safety and compliance visible at all times, which is why real-time monitoring is critical for modern operations. The benefits reach well beyond a single pit:
- Faster response: Live dashboards and automated alerts help teams react to abnormal conditions in seconds.
- Site-wide visibility: One screen can cover multiple mine locations at once, improving control.
- Cleaner compliance: Continuous environmental data reporting creates an audit trail regulators trust.
- Better business performance: Fewer stoppages and incidents protect both productivity and reputation.
Dashboards also support wider goals. As companies track environmental impact — including scope 3 emissions across their supply chain — the same real time monitoring systems become the backbone of transparent reporting. This shift is part of how IoT is changing blast and environmental monitoring across the industry, built on reliable IoT sensors in the field.
Putting It to Work on Your Site
A dashboard is only as good as the data behind it. Accurate air-quality monitoring, dust monitoring, and vibration sensors feed the charts, and the way environmental sensors are transforming mining makes the whole picture possible. When sensors, platform, and dashboard are designed together, the result is a single source of truth for the entire site.
Conclusion
Sensors collect the data, but a dashboard makes it matter. By turning raw environmental data into clear visuals, real time alerts, and defensible reports, an environmental monitoring dashboard helps mining teams protect people, stay compliant, and improve business performance — all from one screen.
Brilliant Info Systems builds connected sensor-to-dashboard monitoring systems for mining and industrial sites. Explore our blast vibration monitoring solution or talk to our team to design a dashboard around your site.
Frequently Asked Questions
What is an environmental monitoring dashboard?
It is a live screen that collects environmental data from multiple sensors — vibration, air, dust, and noise — and shows it as charts, maps, and status tiles, so teams can understand site conditions at a glance and act in real time.
What should I look for in monitoring dashboard software?
Prioritise real time updates, flexible data visualization, custom dashboard views, pre built templates, automated alerts, and one-click data reporting. For mining, it should handle vibration, air, and dust data from multiple sources on one screen.
How does sensor data become meaningful information?
Raw readings are captured by sensors, collected by a gateway, processed in the cloud, and then visualized on a dashboard. Charts, color codes, and alerts turn thousands of numbers into a clear picture anyone can read.
Can one dashboard cover several mine sites?
Yes. Cloud monitoring systems can display data from multiple locations on a single real time mining dashboard, giving a control room full visibility across every site at once.