
From Sensor to Dashboard: How Blast Monitoring Data Travels in Real Time
When a blast fires, a seismograph near the site records it in a fraction of a second. Moments later, a manager sitting in an office — perhaps hundreds of kilometres away — sees the result on a screen and knows instantly whether the blast stayed within safe limits. That near-instant journey, from a sensor in the ground to a dashboard anywhere in the world, is what makes modern blast monitoring so powerful. But how does the data actually get there?
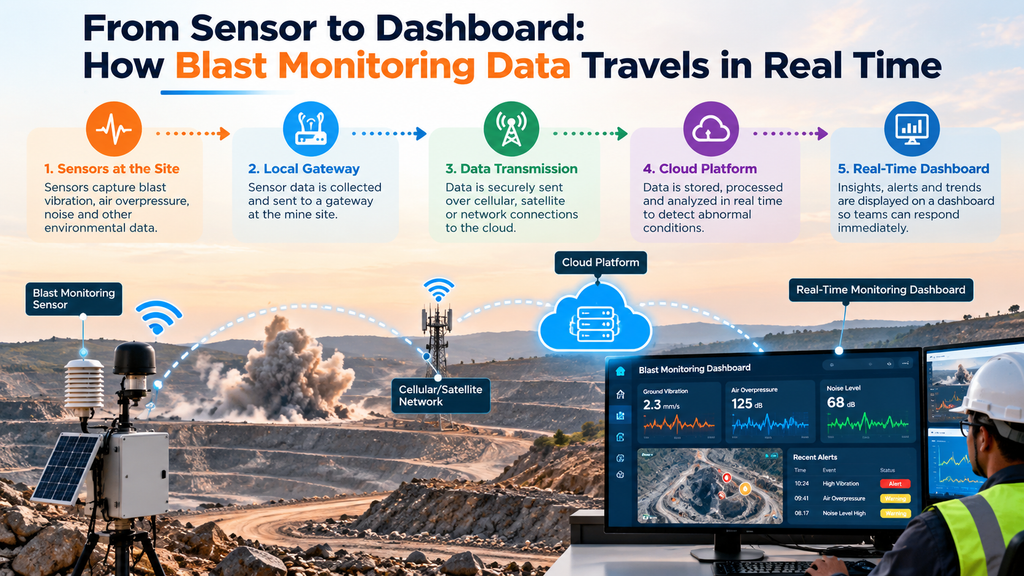
This guide follows blast monitoring data on its complete journey — from sensor to dashboard — explaining how each stage works and how the data travels in real time. It is the pipeline behind any modern blast vibration monitoring solution, and it builds on our guide to blast monitoring sensors.
▶ Watch: Real-Time IoT Monitoring in Action
Table of Contents
- The data journey at a glance
- Stage 1: The sensor
- Stage 2: The seismograph
- Stage 3: Transmission
- Stage 4: The cloud
- Stage 5: The dashboard
- Why real-time delivery matters
- Reliability and the future
- FAQs and conclusion
The Data Journey at a Glance
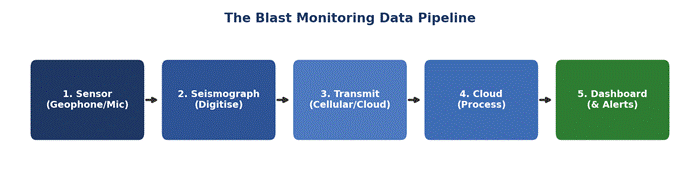
Blast monitoring data passes through five stages on its way from the ground to a decision-maker’s screen. Each one adds value, transforming a physical event into an actionable result:
| Stage | What happens | In plain terms |
| Sensor | Geophone and microphone detect vibration and air overpressure | The blast is felt and heard |
| Seismograph | The signal is digitised and recorded | The reading becomes data |
| Transmission | Data is sent over cellular, satellite, or network | The data leaves the site |
| Cloud | Data is stored, checked, and analysed | The data is understood |
| Dashboard | Results and alerts are displayed | People see and act on it |
Skip or weaken any stage and the whole chain suffers. Let’s follow the data through each step.
Stage 1: The Sensor Captures the Event
Everything begins at the sensor. A triaxial geophone, planted in the ground near the structures being protected, detects ground vibration in three directions, while a microphone captures the air overpressure. Together they convert the physical energy of the blast into tiny electrical signals — the raw material of all blast monitoring.
Sensor placement is critical here: a sensor in the wrong spot measures the wrong thing. Positioned correctly at the point of concern, the sensor sets the accuracy for everything that follows. If the event is not captured cleanly at this first step, no amount of later processing can recover it.
Stage 2: The Seismograph Digitises the Signal
The raw electrical signal from the sensor is analogue and fragile. The seismograph, or data logger, turns it into something useful: it samples the signal thousands of times per second, digitises it, and records the full waveform of the vibration monitoring event. It also identifies the key values — the peak particle velocity, the peak air overpressure, and the frequencies involved.
This is where a fleeting physical event becomes permanent, precise data. Good calibration and a high sample rate matter enormously at this stage, because the accuracy of the recorded data determines the accuracy of every decision made from it later.
Stage 3: Transmission — How the Data Leaves the Site
Historically, this is where the journey stalled: data sat inside the seismograph until someone physically collected it. Real-time monitoring changes that by transmitting the data automatically. As soon as a blast is recorded, the seismograph sends the data onward over whatever connectivity the site has.
How the data travels depends on the location. Cellular networks handle most sites within coverage; satellite connections serve remote or isolated mines; and local networks or mesh links cover underground or shielded areas. Many units also buffer data locally and forward it once a connection returns, so no blast is ever lost. This transmission step is what turns a local recording into real-time, remotely accessible information.
Stage 4: The Cloud Processes the Data
Once transmitted, the data arrives at a cloud platform — the brain of the operation. Here it is stored securely, checked automatically against the applicable limits, and analysed. If a reading approaches or exceeds a threshold, the platform flags it immediately. Across many blasts, the cloud also builds the history that powers trend analysis and better blast design.
Because the processing happens in the cloud rather than on a device at the site, the same data can serve many people at once and feed connected monitoring systems. This is what allows remote monitoring across multiple sites from a single platform.
Stage 5: The Dashboard — Where People See and Act
The final stage is where data becomes decision. The dashboard presents each blast’s results clearly — was it within limits, how does it compare to previous blasts, is any trend emerging — on a screen accessible from anywhere. Instead of raw numbers, managers see a simple, visual answer to the question that matters: was this blast safe?
Crucially, the dashboard is also where alerts land. If a blast exceeds a limit, the system does not wait for someone to check — it pushes an instant notification by email, text, or on-screen warning. This is the moment the whole journey pays off: an event in the ground becomes an action by a person, in seconds.
Why Real-Time Delivery Matters
The speed of this journey is the whole point. When data travels from sensor to dashboard in real time, an exceedance is known the instant it happens — not discovered the next day when someone downloads the seismograph. That immediacy allows teams to pause blasting operations, adjust the next blast, or respond to a complaint with hard evidence straight away.
It is the difference between reacting to problems and preventing them, and it is why real-time delivery has become the standard, as explored in our guide on real-time blast monitoring. Combined with air overpressure monitoring, the full picture of every blast reaches decision-makers instantly.
How Fast Is Real Time?
It is worth being precise about what real time means here. From the instant a blast is recorded to the moment it appears on a dashboard, the journey typically takes seconds to a minute or two, depending mainly on connectivity. On a well-connected site, a manager can see a blast result almost as soon as the dust settles. On a remote site relying on satellite, it may take a little longer, but still far faster than the old model of downloading a device days later.
That speed is what changes behaviour. When results arrive within seconds, the data becomes part of the live decision-making around each blast, rather than a report reviewed after the fact. The whole value of the sensor-to-dashboard journey rests on keeping every stage fast and uninterrupted.
Security Along the Journey
As blast data travels from the field to the cloud, it crosses networks — and that data is both operationally sensitive and legally important. Protecting it matters at every step. Transmission should be encrypted so readings cannot be intercepted or altered in transit, and access to the dashboard should be controlled so only authorised people can view or change settings. Secure cloud storage then keeps the historical record intact and tamper-evident.
This security is not just good practice; it is what lets the data serve as trustworthy evidence. When a regulator or resident asks what a blast produced, an operator needs to show data that is demonstrably accurate and untampered from sensor to dashboard. A secure journey is what makes that possible.
Reliability and the Future of the Data Journey
Because the value depends on the data completing its journey, reliability matters at every stage. Sensors must be calibrated, connectivity must be robust with local buffering as backup, and the cloud platform must be secure and always available. A single broken link — a dead sensor, a lost connection — creates a gap in both safety and compliance, so good systems build in redundancy.
Looking ahead, the journey is getting faster and smarter. Edge processing lets urgent analysis happen on the device for instant response, while AI in the cloud turns the accumulated data into predictions and recommendations. The direction is clear: from simply moving data quickly to moving intelligence quickly — delivering not just readings, but answers, in real time.
Conclusion
The journey of blast monitoring data — from a sensor in the ground to a dashboard on a screen — is a small miracle of modern engineering that happens in seconds. Each stage, from detection to digitisation, transmission, cloud processing, and display, plays its part in turning a physical blast into an instant, actionable result.
Understanding this journey shows why real-time blast monitoring is so valuable: it delivers not just data, but timely answers, wherever they are needed. Explore our related guides on blast monitoring sensors and how IoT is changing blast monitoring to see the full picture.
See the Full Data Journey with Brilliant Info Systems
Brilliant Info Systems delivers a complete blast vibration monitoring solution — from IoT and smart sensors to real-time transmission, cloud analysis, and clear dashboards. Contact our team to bring every blast from sensor to dashboard in real time.
Frequently Asked Questions
How does blast monitoring data travel from sensor to dashboard?
A sensor captures the blast, a seismograph digitises and records it, the data is transmitted over cellular, satellite, or network to a cloud platform where it is processed, and the results and alerts appear on a dashboard — all in real time.
How is blast data transmitted in real time?
As soon as a blast is recorded, the seismograph sends the data automatically over the site’s connectivity — cellular, satellite, or a local network — to a cloud platform, often buffering locally so no data is lost if the connection drops.
What happens to blast data in the cloud?
The cloud stores the data securely, checks each reading against limits, analyses trends across blasts, and triggers alerts if a threshold is exceeded — turning raw readings into compliance results and insight.
Why does real-time data delivery matter in blasting?
Because it means an exceedance is known the instant it happens, letting teams act immediately — pausing operations, adjusting the next blast, or answering a complaint with evidence — rather than discovering it a day later.
What can disrupt the data journey?
A dead or miscalibrated sensor, a lost network connection, or an unavailable platform can each create a gap. Good systems guard against this with calibration, local data buffering, and secure, reliable cloud infrastructure.
Can I see blast data from multiple sites in one place?
Yes. Because processing happens in the cloud, data from many sites can be viewed on one dashboard, enabling remote, centralised monitoring of blasting across an entire operation.